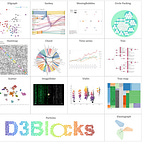
Python has become one of the most popular programming languages to analyze and visualize your data. Visualizing can be the key to success in projects because it can reveal hidden insights in the data, and improve understanding. The best way to understand and explain the data is by making it interactive. Despite many visualization packages being available in Python, it remains challenging to create beautiful, stand-alone, and interactive charts that can also work outside your machine. In a previous blog, I readily showed how to create a stand-alone, interactive chart for network graphs. With D3Blocks we go beyond a single chart and created a framework that now contains 10 beautiful charts. It is open-source, and there is no need to install anything else than Python to create D3 charts. The output is an interactive chart for which you only need an (internet) browser; sharing and publishing becomes super easy. In this blog, I will introduce D3Blocks, and briefly describe the blocks with hands-on examples.
If you find this article helpful, you are welcome to subscribe because I write more about Data Science and Visualization.


