
Large networks can contain valuable information about relationships, structures, and hidden patterns, but understanding these connections becomes increasingly difficult as the number of nodes and edges grows. Traditional network visualizations provide an effective overview of the overall graph, yet they often become visually overwhelming when the goal is to investigate the relationships surrounding a specific node. A different perspective is needed: complex graphs are not only a visualization problem, but also an exploration problem.
An important question for large network analysis is thus how to explore the networks while maintaining focus on the relationships that matter? When analysing networks, we naturally start from a single concept and follow its connections outward. With RadialGraph, I aim to introduce a new force-directed graph visualization layout based on this intuitive principle. Instead of organizing nodes around an arbitrary center, the visualization is arranged in concentric rings around a focal node, allowing exploration of connected data one hop at a time, expanding entire neighborhoods, or revealing relationships as a rippling wave. Unlike hierarchical tree layouts, RadialGraph makes no assumptions about parent-child relationships and naturally supports general many-to-many networks, including cycles and nodes that can be reached through multiple paths.
In this blog, we will explore the concepts behind RadialGraph and examine how it differs from traditional force-directed graph layouts. You will learn how a source-target-weight edge list can be transformed into an interactive node-centric visualization. Along the way, we will examine the underlying layout algorithm, hierarchical organization, expand-and-collapse interactions, and edge roles that make navigating knowledge graphs and social networks more intuitive. By the end of this blog, you will be able to transform complex connected data into stand-alone, interactive, and easy-to-share knowledge maps that place exploration at the center of network analysis. Radialgraph is part of the Python library D3blocks and will be used throughout this blog.
If you found this article helpful, you are welcome to follow and subscribe because I write more about Data science! I recommend experimenting with the hands-on examples in this blog. This will help you to learn quicker, understand better, and remember longer. Grab a coffee and have fun!
Introduction
The central idea of radial graphs is to arrange nodes around a central point. Depending on the application, radial layouts can take many forms, such as radial trees, dendrograms, and networks. These approaches are effective when the underlying data has a clear hierarchy or when the goal is to present a compact overview of network structure. However, many real-world networks do not follow a simple hierarchy.
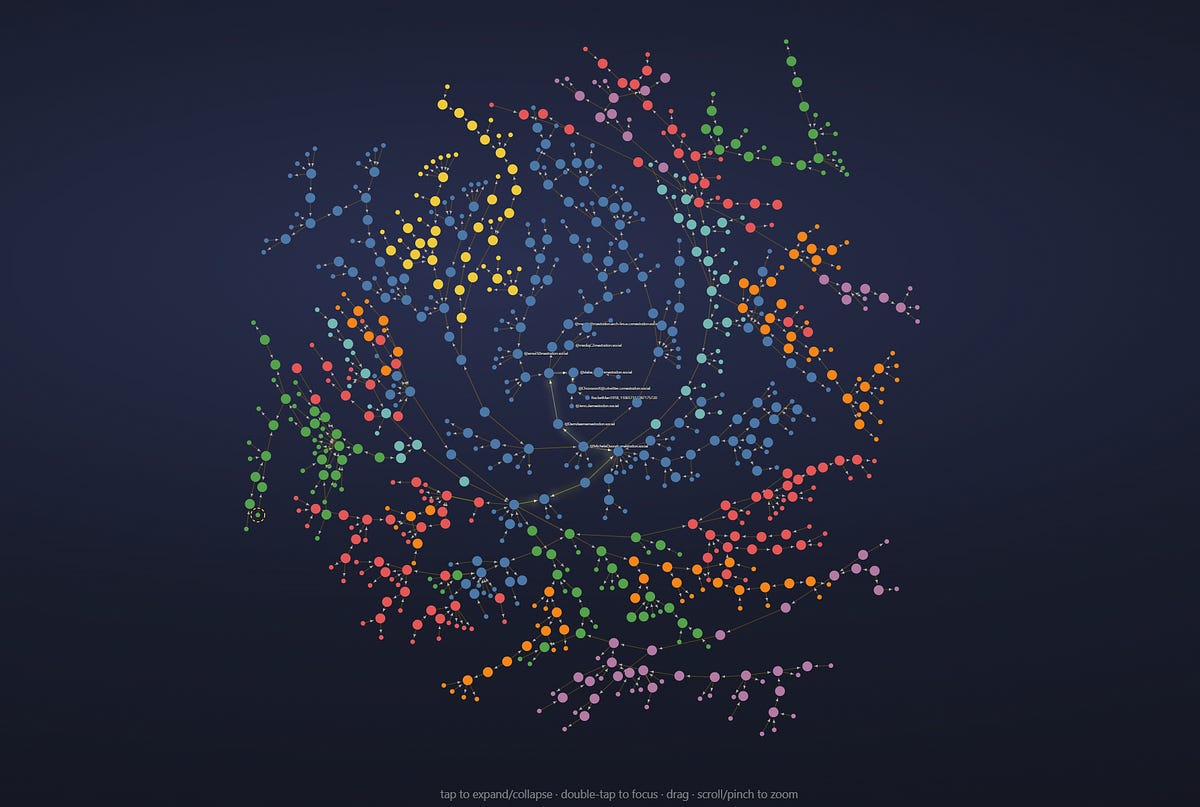
Social networks, knowledge graphs, citation networks, and interconnected documents are typically many-to-many structures containing cycles and multiple paths. Unlike radial trees or dendrograms, the new RadialGraph in D3Blocks does not require relationships to follow a parent-child hierarchy. Instead, nodes are organized by their hop-distance from a focal node, allowing general network structures to be explored radially. RadialGraph thus takes a different approach. It combines the flexibility of a force-directed network with the spatial organization of a radial layout. Any node can become the focal point of exploration, with the selected node placed at the center and connected nodes arranged in concentric rings according to their hop distance. Direct neighbors appear in the first ring, nodes two connections away in the second, and so forth.
RadialGraph combines the flexibility of a force-directed network with the spatial organization of a radial layout.
This creates a visualization that is not only about where nodes are located, but about how we explore a network. Starting from a person, document, account, or concept, you can progressively expand the surrounding network and see how relationships propagate outward. The result is a node-centric view that preserves the many-to-many nature of the original graph while providing the focus needed to explore complex networks interactively. Throughout this blog, we will explore how RadialGraph works and how it can be used with D3blocks to turn connected data into interactive knowledge maps.
The New Force-Directed Radial Graph
Regular force-directed network layouts, such as the D3Blocks-D3graph visualization, are excellent for providing an overview of the entire network. However, as networks grow larger, they become increasingly difficult to interpret because every node and edge competes for the same visual space. When your goal is to investigate the relationships surrounding a particular node rather than inspect the complete network at once, a different exploration strategy is needed. More details about D3Graph can be found here:

When networks grow larger, interpretation becomes more difficult because every node and edge competes for the same visual space.
RadialGraph addresses this challenge by organizing the network around a single focal node. Instead of presenting every relationship simultaneously, connected nodes are revealed progressively as you explore outward. This keeps the visualization focused, preserves context, and allows users to navigate even complex networks without becoming overwhelmed.
Use RadialGraph if:
You want to start from one node – such as a person, document, concept, or social media account – and progressively discover its surrounding neighborhood.
Your network is too large to inspect all at once, but you still want the freedom to reveal the complete graph whenever needed.
Hop distance matters. Concentric rings represent the shortest-path distance from the focal node, making it immediately clear which nodes are directly connected and which are several steps away.
You prefer interactive exploration over static visualization. Expand or collapse branches on demand, preview hidden neighborhoods before revealing them, or watch relationships unfold as a ripple through the network.
Unlike tree or dendrogram layouts, RadialGraph makes no assumptions about hierarchical data. It is designed for general many-to-many networks, supporting cycles, multiple paths between nodes, and densely connected structures while preserving the familiar force-directed appearance of d3graph.
Two layout modes in RadialGraph
RadialGraph supports two complementary layout modes, allowing you to switch between exploring the complete network and investigating the neighborhood of a specific node. Both modes use the same underlying force-directed graph, but differ in how node positions are organized. The two modes complement each other. Global mode provides an overview of the complete network, while Local mode allows you to investigate the relationships surrounding any node without losing context. Together they combine the strengths of traditional force-directed layouts with a focused, interactive exploration model.
Global mode answers: What does the network look like? Local mode answers: What is connected to this node?
Local mode
In local mode (center=node_name), the visualization is organized around a focal node. This node remains fixed at the center while all other nodes are positioned in concentric rings according to their shortest-path (BFS) hop distance. The first ring contains the direct neighbors, the second ring contains neighbors of neighbors, and so on. This layout makes it immediately clear how closely each node relates to the current point of interest, creating an intuitive, node-centric exploration experience. Note that the center node can be interactively changed.
Global mode
In global mode (center=None), RadialGraph behaves as a traditional force-directed network where nodes find their position solely through attractive and repulsive forces. No concentric rings are imposed, allowing the overall network structure and communities to emerge naturally. Internally, RadialGraph still determines a focal node (the node with the highest degree), allowing users to seamlessly switch to Local mode at any time without recomputing the graph.
Interactive Functionalities
RadialGraph has various interactive components to help explore the data:
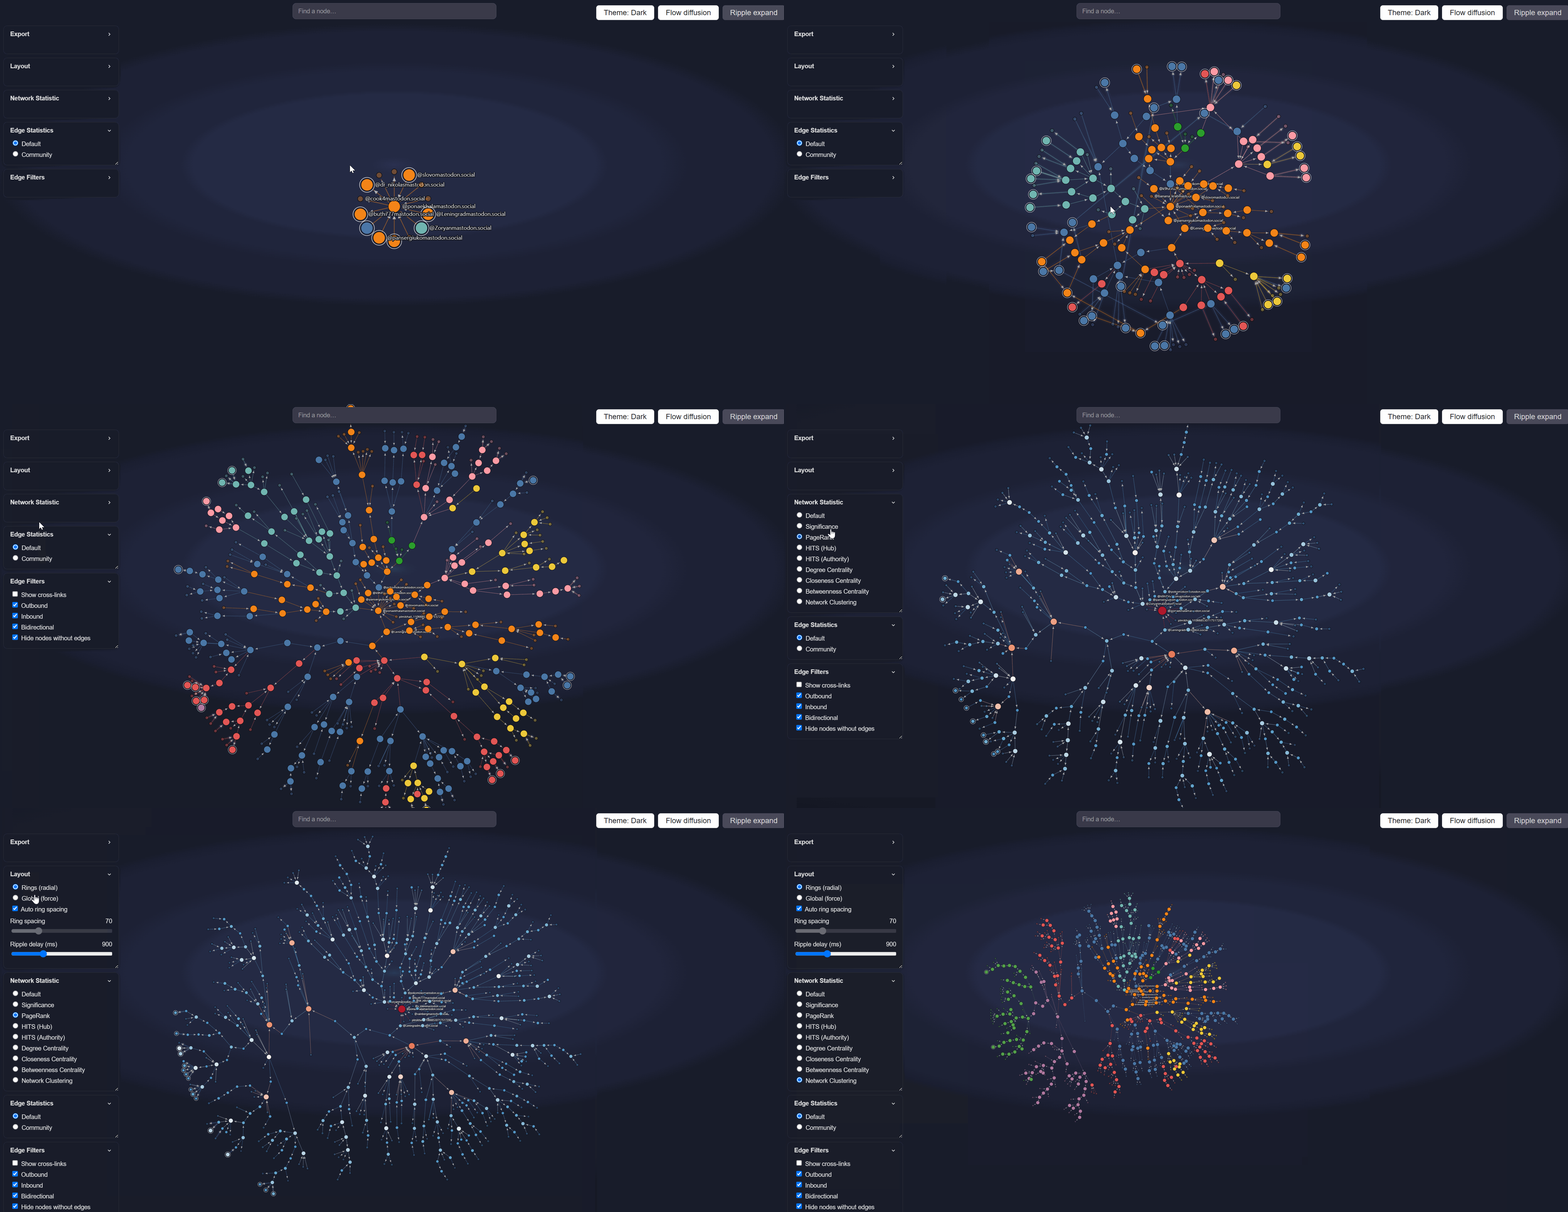
Node Expand/collapse: a node with hidden neighbors shows a subtle ring indicator; tapping it reveals those neighbors (or hides them again on a second tap). Newly revealed nodes animate outward from the node you tapped, and existing nodes are briefly frozen in place so the graph makes room locally instead of reshuffling everywhere.
Ghost preview: hover (desktop) or press-and-hold (touch) a node with hidden neighbors to draw faint, dashed preview markers showing where they’d land if revealed before you commit to expanding.
Ripple expand: reveals the network one hop at a time from the focus outward, each ring settling before the next appears, instead of everything popping in simultaneously. Useful for showing “how the network grows” — e.g. a person, then their direct connections, then connections of connections — almost like a wave. Configurable via
ripple_delay_ms.Ring spacing, auto or manual: by default, spacing between rings is computed from how crowded each ring actually is (
auto_ring_spacing=True), so a ring with many nodes automatically gets pushed further out. Turn this off (auto_ring_spacing=False) to control spacing directly viaring_spacing.Labels that fade in with zoom: labels for nodes close to the focus appear first; deeper, more numerous nodes’ labels only appear as you zoom in, with collision-avoidance so crowded rings don’t turn into overlapping text.